Precision placing of small wind turbines

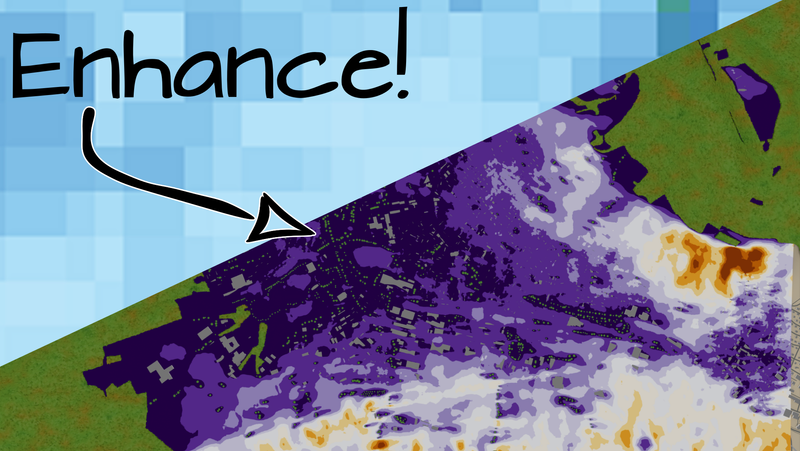
In spy movies there’s often the iconic demand to Enhance! - to increase an images resolution sufficiently for the hero to move forward. While a completely different situation, many operators for small-scale wind installations may have wished for such a solution to enhance publicly available wind maps to an extent that allows them to place their wind turbine in the best possible spot with confidence.
In this article we are showing how operators of small-scale wind turbines can get such highly ‘enhanced’ detailed wind information, what is currently possible and also what the limitations are.

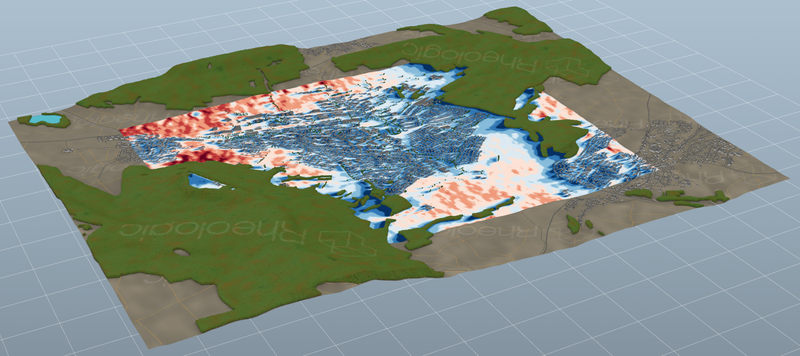
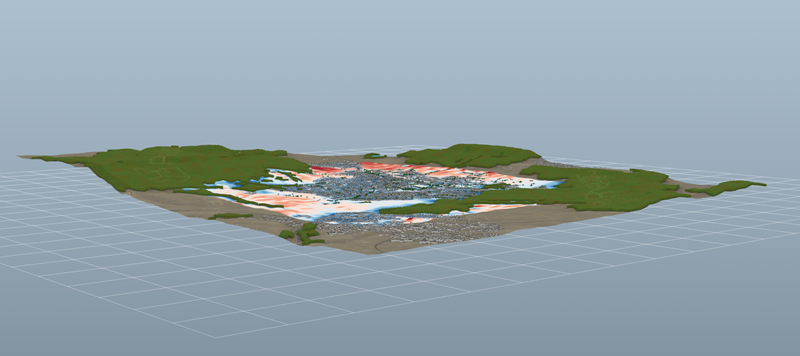
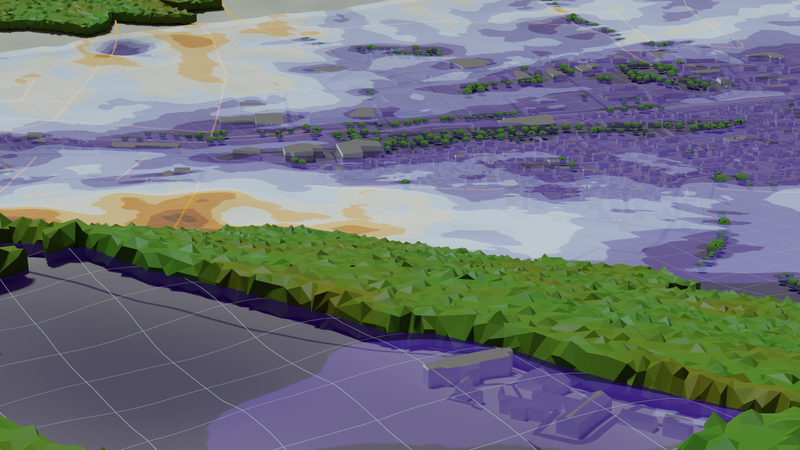
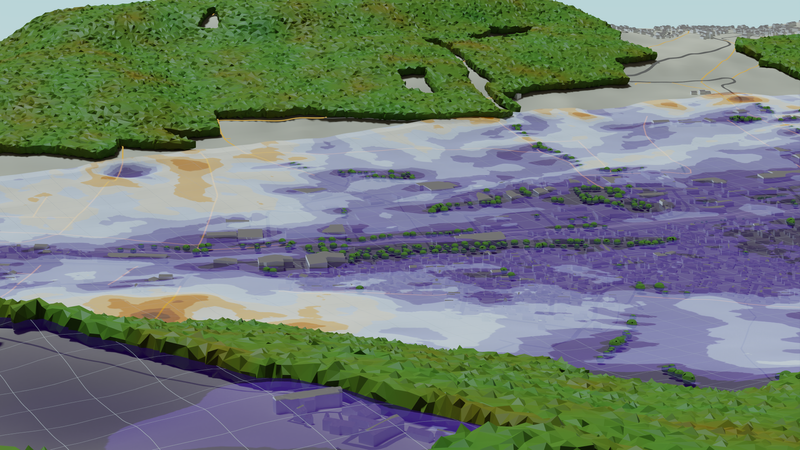
For our discussion we are looking at the wind around the city of Spaichingen, Germany. The city is surrounded by hills and partially by forest. It was simply chosen because we had the data readily available from a previous project. The two images below are of the area as we modelled it - the total extent is roughly 5x5 km. The elevation-style-images show the hilly terrain. For comparison below there is also a satellite images as it can be seen on the GWA website. Judging from the images it might have been taken in the fall since some trees seem to have shed their leaves.


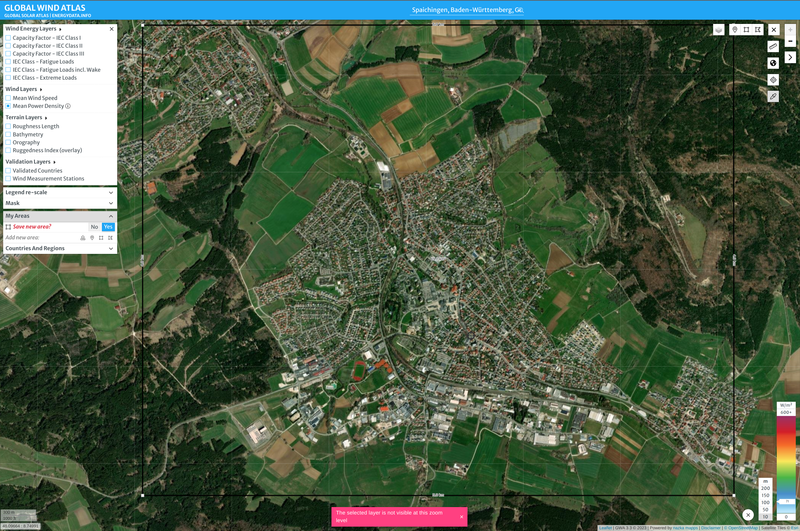
The Global Wind Atlas (GWA) is an excellent resource to find the best spots for wind turbines and often the go-to solution when it comes to the placement of small wind turbines. Wind velocity is of utmost importance to get the maximum yield out of an investment into a wind turbine and the GWA is the go-to website for smaller companies and private citizens to find exactly these places. However, while the GWA does a great job to show wind velocity globally, it’s local resolution may be insufficient for smaller projects that cannot afford to make additional measurements.
While wind velocity, and by extension power density, are by far the biggest influence factors on the economic viability of a small wind turbine, there are many other factors in addition to wind, that are important when selecting the location. The website klein-windkraftanlagen.com has an excellent guide published about this topic (website in German).
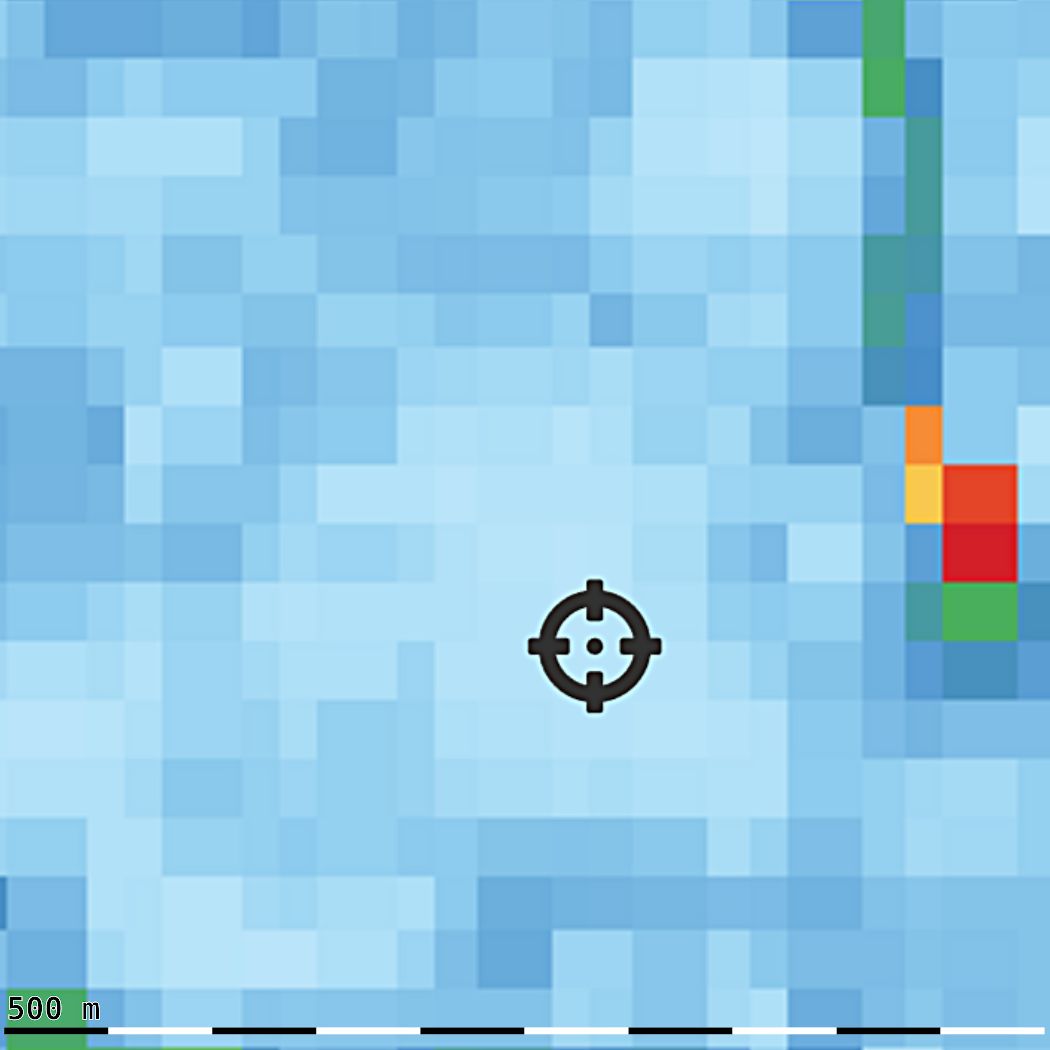
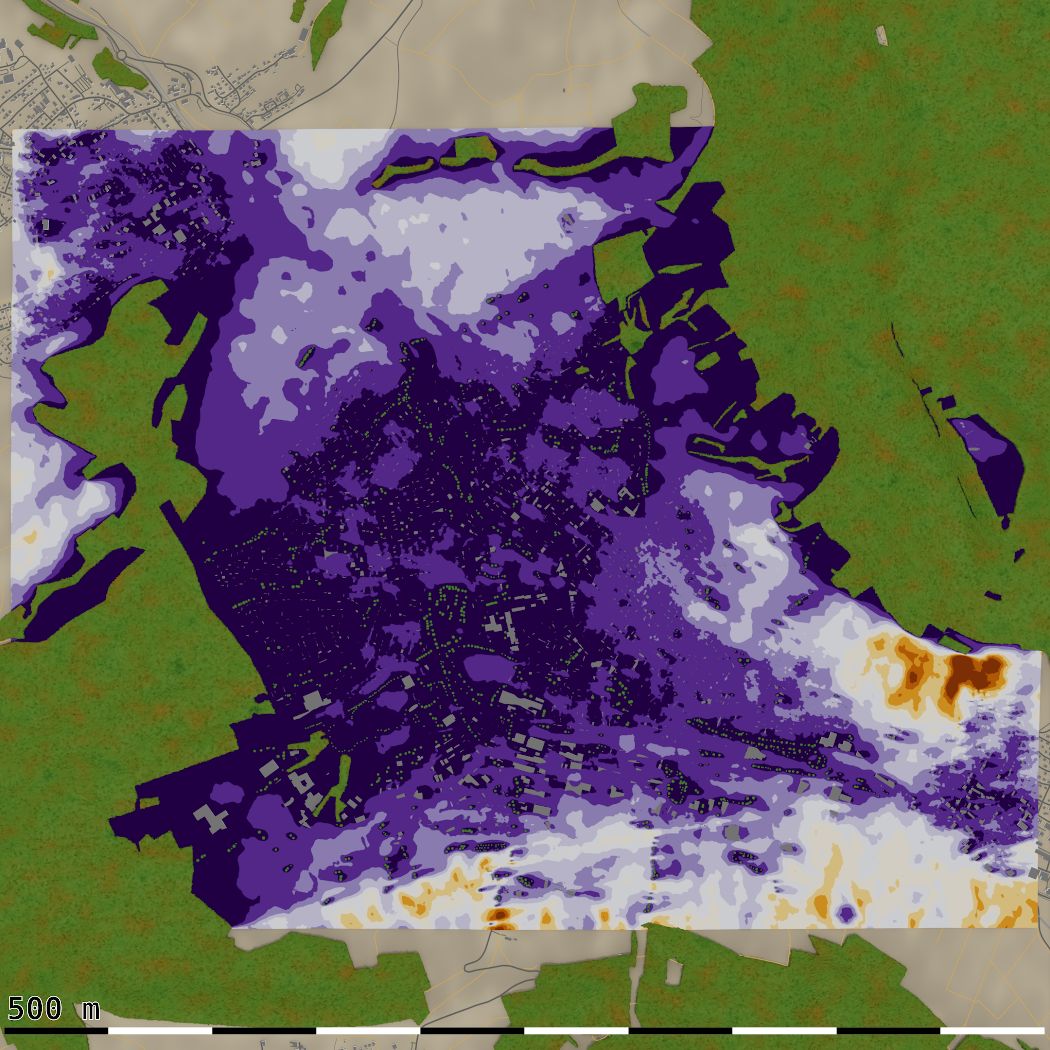
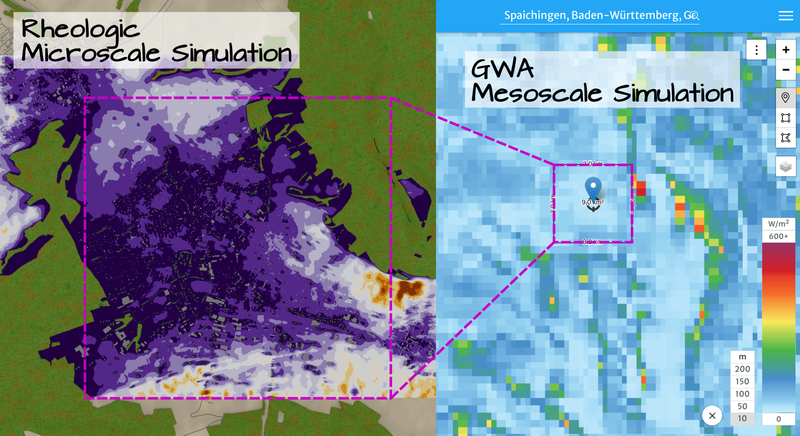
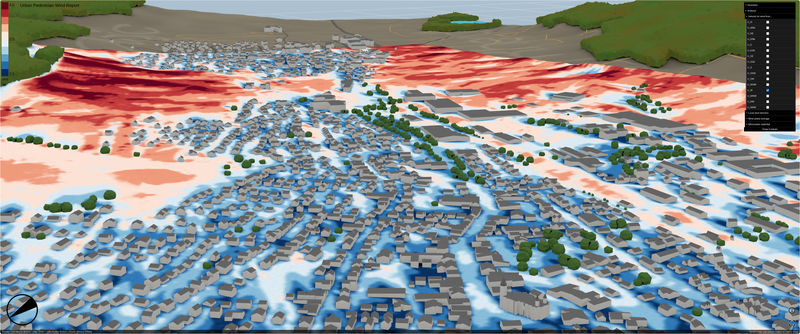
For exactly these situations we offer our wind simulation service in a price range that will - in many cases - result in an shorter break-even period and ultimately in better overall return for the investment. Even if investment costs are secondary to - for example - ecological motivation, it still makes sense to try to get the most out of one’s wind turbine. So how does this look? The image above shows the GWA power density over the city of Spaichingen, Germany and the same area again simulated by Rheologic.
While both images use a different color scale it’s clear that the Rheologic simulation has a significantly higher resolution down into the sub-meter range. Moreover, while forest is included in the GWA simulation, it is included in a way that doesn’t give it any actual height. Even better, the Rheologic simulation is also available as interactive 3D model that can be used right in the browser. To have a look, just click the following link.
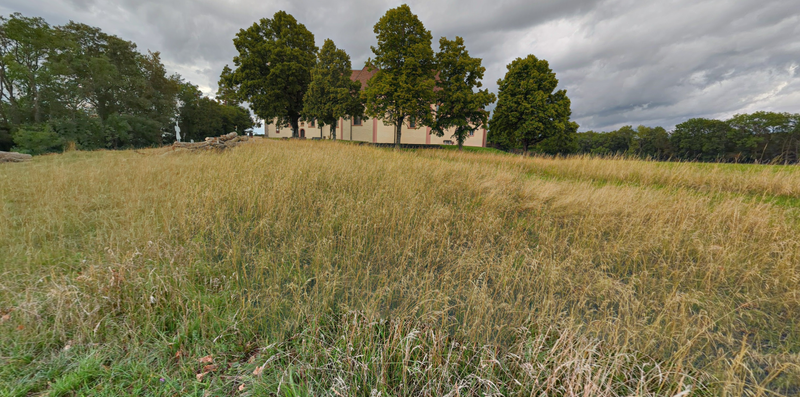
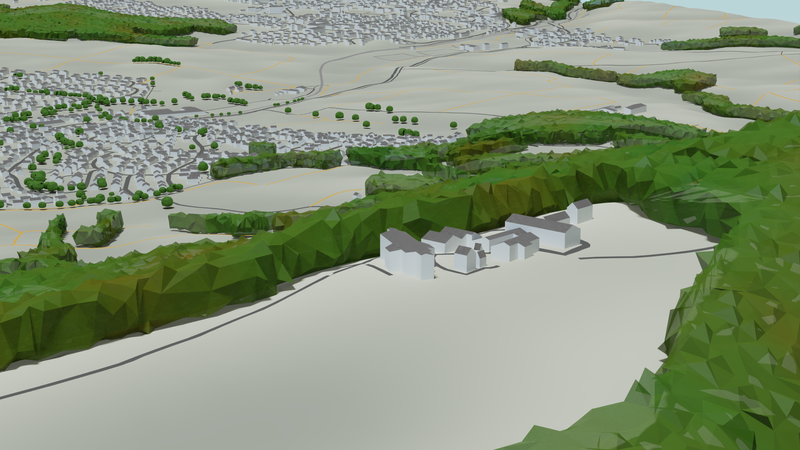
An interesting area ist the “forest clearing” area at the middle-right edge of the image above. The GWA shows this as a relatively interesting area for a wind turbine because it’s basically the top of a hill and free of trees. However as the images of this hilltop show, the clearing is surrounded by trees well exceeding crown heights of 10 meters and is probably not a good place for a wind turbine.


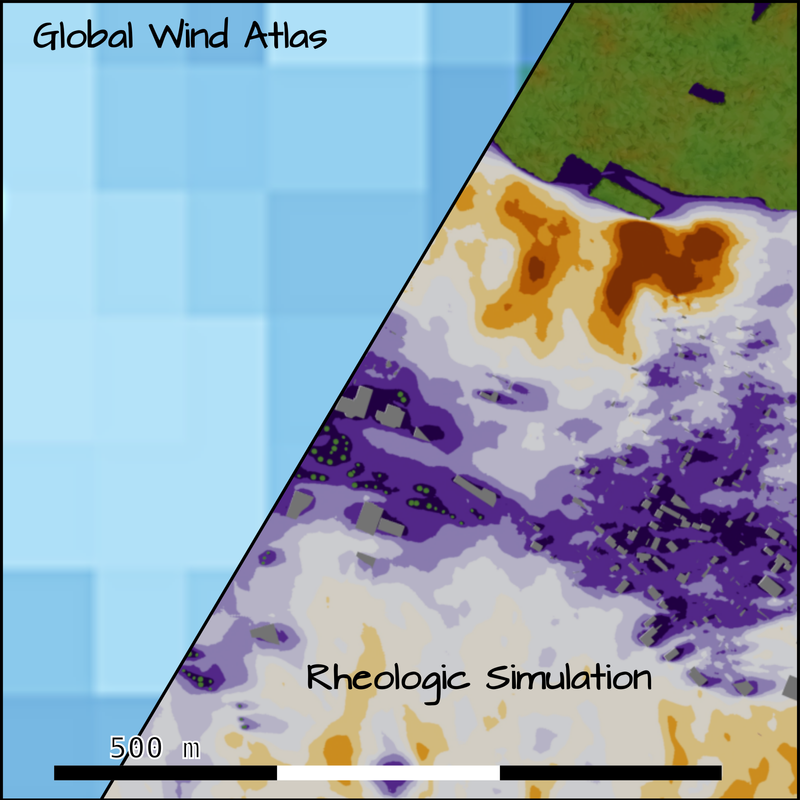
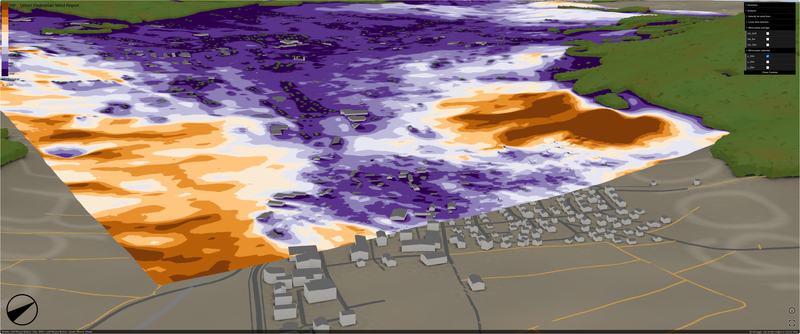
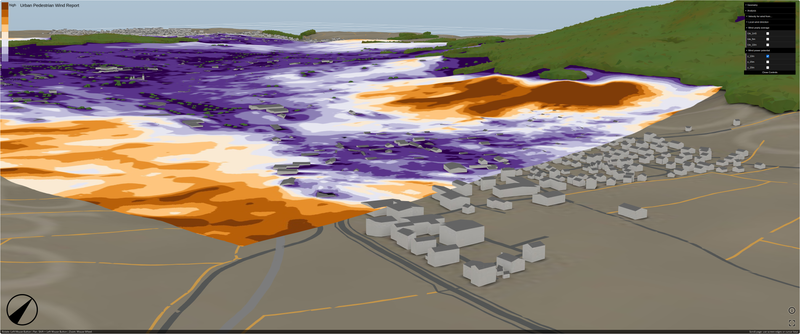
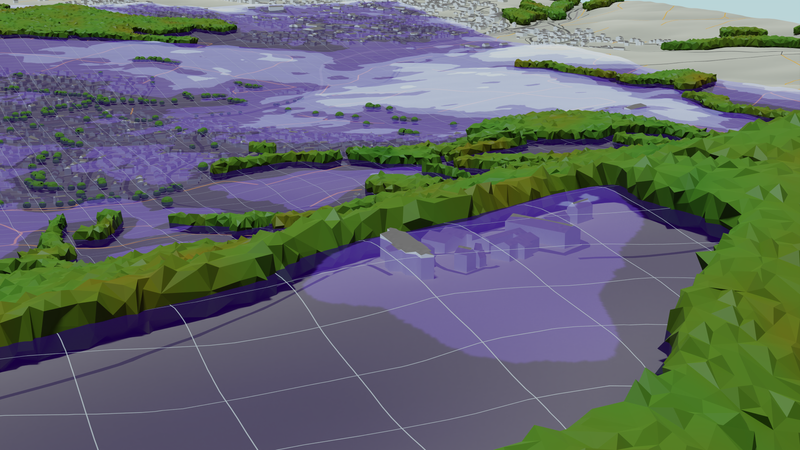
Similarly it’s clear that the resolution of the power density (respectively average wind velocity) around buildings in the GWA is not sufficient to accurately place wind turbines there, simply because such structures (houses, trees, …) are too small to show up in the coarser resolution.
Here is a closer view that shows that it is very difficult to use GWA information to accurately place wind turbines in the vicinity of houses, or generally on terrain that has lot’s of differentiated wind obstacles in the vicinity. The resolution of a simulation needs to be a lot higher in order to capture the effect of these surface features on the wind velocity.

If you are about to install a wind turbine, you’ll probably be eager by now to know the website, that allows you to get such detailed wind information data… and with that we have arrived at the discussion of the limitations of this approach:
The data in the GWA is a, so called, mesoscale simulation, that means, that is uses the wind velocity of large weather models in a grid of about 10km and a relatively coarse terrain representation to calculate the data that you seen on their website. Conversely what we are showing is a microscale simulation that includes much more detail, but cannot be used over a large area. Typically this microscale simulations are done with software that is - for example - commercially offered by the makers of the WorldBank-funded GWA project. However for small-scale wind turbine projects, it is often not feasible to use this software due to very high cost and expert training requirements. Therefore these simulations are often only available to larger wind park installations, but not cost effective for smaller commercial or private projects
Conversely, our simulations as exemplary shown above cannot be simply pulled from a map, but needs to be tailored to every location. The advantage is, that the costs for a detailed simulation starts from below one thousand EUR, which is well in the range of still being cost effective for smaller installations over their lifetime.
Since we are simulating directly from a weather model 1 without an mesoscale intermediary model, we can offer better rates and higher resolution, however the absolute values of the energy density may be off, especially in very steep areas with a high ruggedness index. In terrain like shown above - which is probably the majority of cases, also the absolute values of our simulations will be close to actual ground conditions.
In any case, our offer addresses the use case of small businesses and private investors (small-scale turbines) that are most interested to find out where to place their turbines on the microscale: On which side of the building? Does it make sense to go 3 meters higher? …and similar questions. And for those, there is now an answer! :)
So if you are a business thinking about supplementing your photovoltaic installation with wind energy, a climate-conscious community that wants to go the extra mile to generate sustainable electricity on a local scale, or a private individual, who wants to produce sustainable energy also at night and during winter time, just send us an email and let’s talk. Because sustainability and economic viability are not mutually exclusive anymore for small scale wind energy.
We are in no way affiliated with the makers of the GWA. Data and images above were partly obtained from their website under the permission published on their website. The full attribution of this work is:
Information and images obtained from the “Global Wind Atlas 3.0, a free, web-based application developed, owned and operated by the Technical University of Denmark (DTU). The Global Wind Atlas 3.0 is released in partnership with the World Bank Group, utilizing data provided by Vortex, using funding provided by the Energy Sector Management Assistance Program (ESMAP). For additional information: https://globalwindatlas.info”
Published: